While teen spending is down a self-reported 6% YoY, athleisure still commands the attention — and dollars — of Gen Z consumers. Nike remains the most popular clothing brand among both boy and girl teen consumers, with a 34% popularity share overall. However, there are signs that the brand’s hold on teen consumers may be weakening at the same time that competitors such as Hoka, On Running and New Balance are making gains.
While Nike remains the favorite footwear brand, mindshare decreased 190 basis points (bps) YoY and 230 bps from fall 2023. The footwear giant has recently shaken up its structure, appointing a new president for its immensely popular Jordan footwear brand in May of 2023. This came shortly before Nike shifted towards a more holistic approach to wellness in an effort to capture that growing market in 2023 and is promising a more bold approach to marketing going forward as growth flattens.
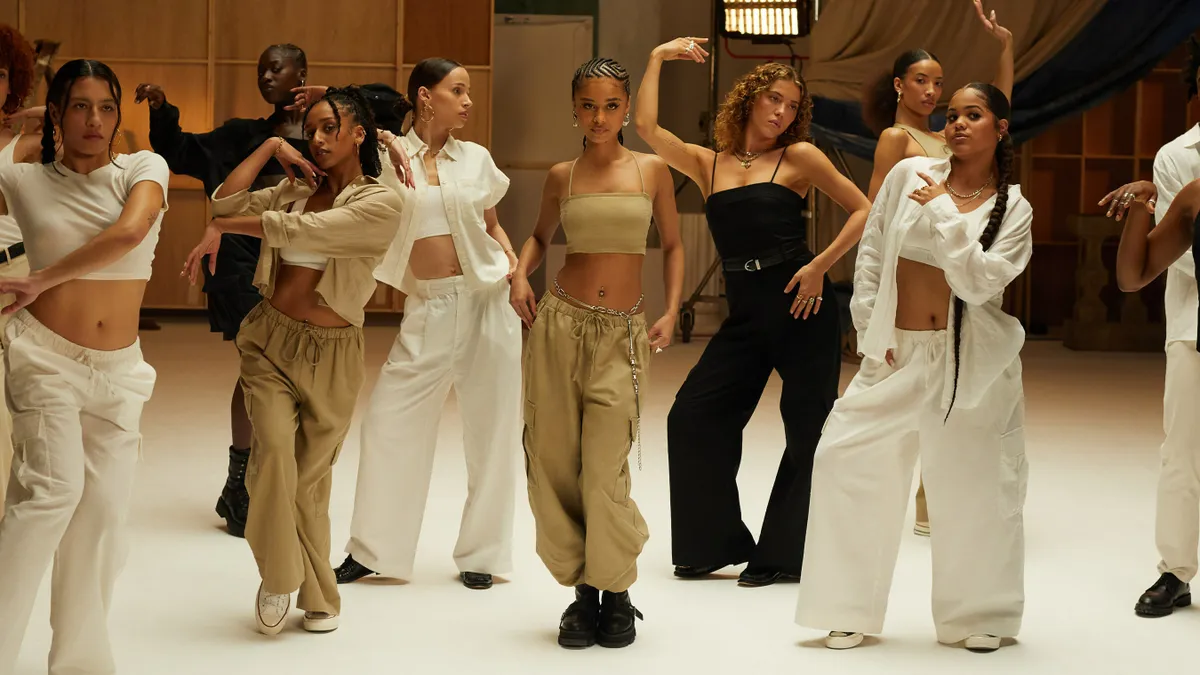
The latest installment of Piper Sandler’s “Taking Stock With Teens” survey shows athleisure finding consistent success with this important demographic. Upper-income teens have been especially drawn to sporty brands, with 46% of preferred brands being “sporty.”
The teen closet
While falling a point in popularity between fall and spring, Nike remains the most popular brand across genders and upper income and average income teenagers. American Eagle came in second, with 6% of teens labeling it as their favorite. Lululemon came in a close third, with 5% of teens overall labeling their preferred clothing brand.
Boys leaned into athleisure at a higher rate than girls, with the top two brands among the former group overall being athleisure. While well behind Nike, Adidas came in a consistent second. This did not change between income levels.
Teenage girls also listed Nike as the number one apparel brand for all income levels, but at a much lower rate compared to teenage boys. American Eagle was a much closer second for teenage girls compared to Adidas for teenage boys. American Eagle overtook the second place spot from Lululemon in spring of 2023 and has maintained an incredibly narrow lead over the brand since.
Nike has seen increased competition in recent years, especially among upper-income girls. Lululemon has constantly ranked above Nike, with 45% listing it as a preferred brand compared to just 35% listing Nike as the preferred brand. However, when looking at average-income teenage girls, Nike reigned supreme, with 53% listing it as a preferred brand compared to just 22% listing Lululemon as a preferred brand.
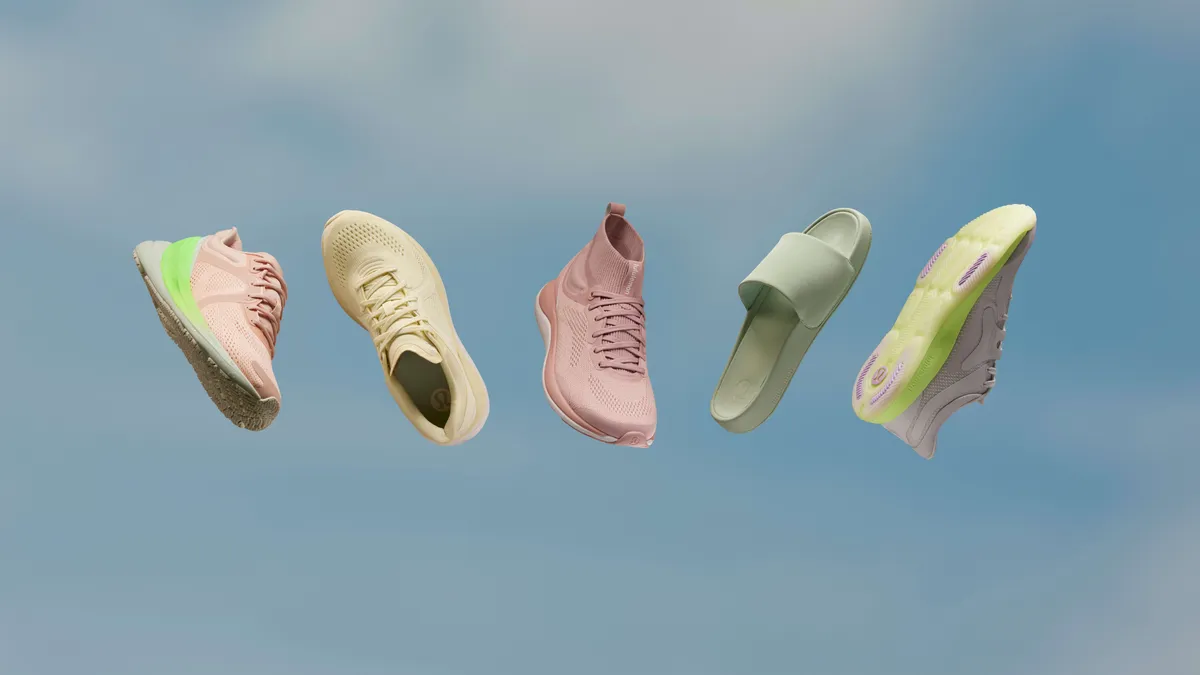
In athletic footwear, Hoka, On Running and New Balance are gaining the most in mindshare.
Teens’ favorite channels
While Gen Z and millennials are known for being an online generation, online-only e-tailers were the second most popular way for upper-income teens to get their merchandise, at 22%. Specialty retailers claimed the number one spot, at 25%. However, this was a decrease of 165 bps YoY and a 295 bps decrease compared to last fall. Online only retailers jumped up from 21% among all teens last fall.
The secondhand market has also become a bigger channel for upper-income teenagers. Secondhand e-commerce retailers are more popular with girls, though dropped from 33% to 32% compared to the fall of 2023 by share of adoption. However, teenage boys' adoption jumped from 19% to 21% over the same time period.
Secondhand shopping is not as popular as secondhand selling among upper-income teens. While 46% of upper-income teens overall have purchased items secondhand, 53% have sold on a secondhand marketplace. Female engagement with secondhand selling is slightly higher than male engagement, at a rate of 59% compared to 50%.
The “Taking Stock With Teens” survey is conducted semi-annually, with the most recent report being the 47th release. In total, 6,020 teens were surveyed across 47 states. The average age was 16.1 years-old with a household income average of $66,280. Thirty-eight percent of surveyed teens are currently enrolled part time. Over half (54%) of respondents were boys, 44% were girls and 2% were non-binary. Forty-three percent of respondents were located in the South, 19% in the West, 28% in the Midwest and 9% in the Northeast.


